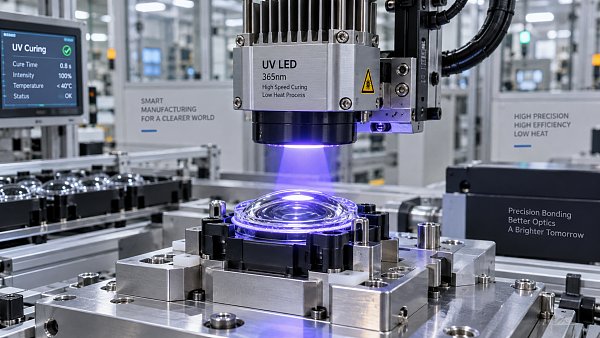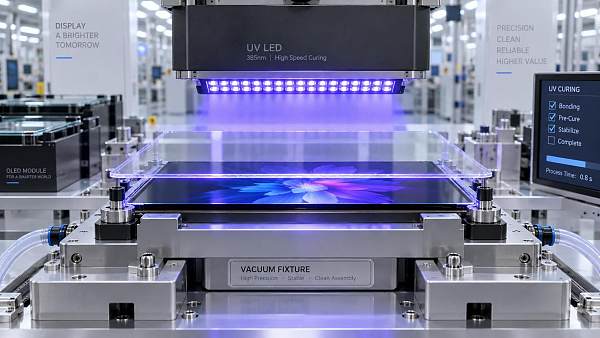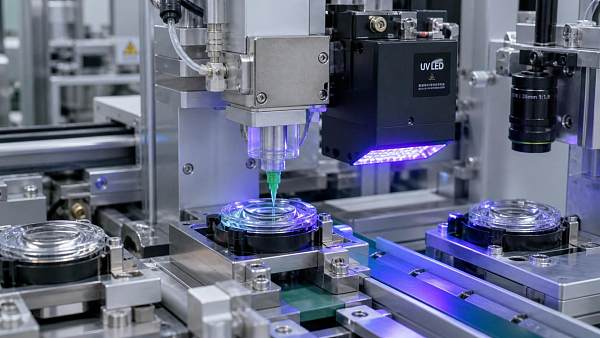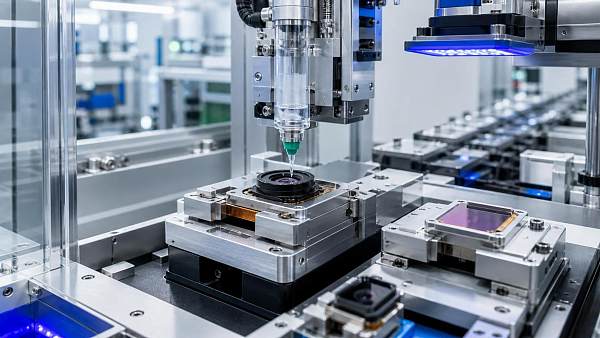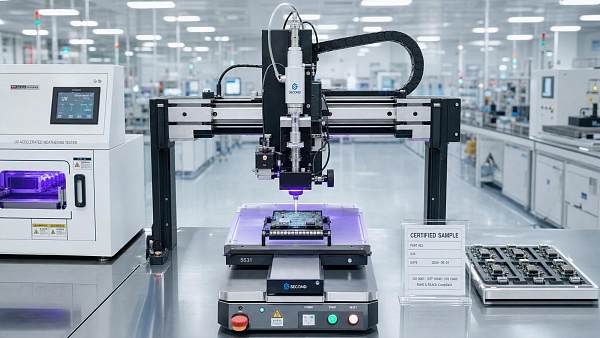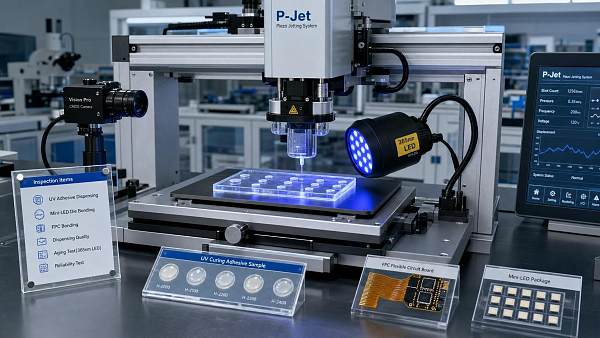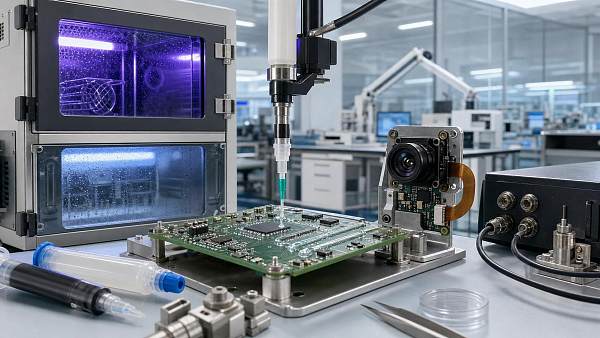
Optical alignment can shift during adhesive curing, turning a precisely positioned lens, sensor, or fiber into a source of performance loss in precision assemblies.
For technical evaluators, low shrinkage UV curing adhesives offer a way to limit cure-induced displacement, but shrinkage alone does not predict long-term alignment stability.
Bond-line geometry, adhesive modulus, UV exposure, and thermal expansion also influence residual stress and positional drift. Their interaction determines whether initial alignment survives production and service.
The practical decision is therefore application-specific: select materials using comparable shrinkage data, then verify alignment retention under representative dispensing, curing, fixture release, and environmental conditions.
Why can a precisely aligned optical assembly move during curing?
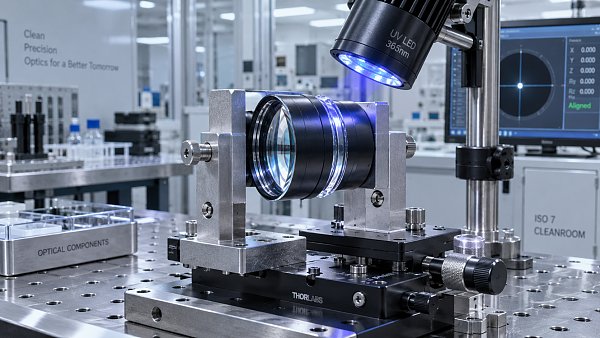
UV-curing adhesives form polymer networks when exposed to suitable light. As reactive groups convert, material density generally increases, producing contraction within the adhesive joint.
Before gelation, some contraction can be accommodated through flow. After the network develops, constrained contraction increasingly generates stress against the bonded components and surrounding structure.
That stress can translate a lens, tilt a sensor, distort a thin substrate, or change the gap between a fiber and its coupling optic.
The resulting optical penalty depends on the assembly. Camera modules may lose focus uniformity, while fiber assemblies may show reduced coupling efficiency or increased insertion loss.
A small displacement is not automatically harmless. Its significance depends on optical sensitivity, including depth of focus, mode-field dimensions, lens design, and angular alignment tolerance.
Lower shrinkage reduces one source of mechanical loading. It does not guarantee that the remaining loading produces an acceptable displacement in a compliant optical assembly.
Conversely, a material with greater measured shrinkage can sometimes retain alignment better when its stress development, geometry, and mechanical constraints are more favorable in combination.
Evaluators should therefore ask two separate questions: how much does the adhesive contract, and how does the actual assembly respond to that contraction during curing?
Which shrinkage data can you actually compare?
Supplier specifications become useful only when the measurement definition is clear. Volumetric shrinkage, linear shrinkage, and assembly displacement describe different quantities and cannot be substituted directly.
For small, isotropic deformation in an unconstrained specimen, linear shrinkage is approximately one-third of volumetric shrinkage. Constrained adhesive joints rarely reproduce that idealized behavior exactly.
For illustration, 1% volumetric shrinkage corresponds approximately to 0.33% free linear contraction. Across a 100-micrometer thickness, that represents roughly 0.33 micrometers of unconstrained dimensional change.
This calculation provides a scale estimate, not a prediction of lens movement. Substrate stiffness, bonded area, geometry, and cure gradients determine the actual displacement direction.
Compare products only after checking specimen preparation, measurement temperature, exposure conditions, and the time at which shrinkage was recorded. Different methods can produce different rankings.
Also establish whether the reported value includes the complete cure schedule. A measurement after an initial UV tack may omit contraction during subsequent curing steps.
Request information about conversion or cure completion alongside shrinkage results. An apparently favorable value can reflect incomplete polymerization rather than intrinsically lower contraction at comparable conversion.
Finally, ask suppliers to distinguish measured results from typical values and application claims. Technical evaluation requires test conditions, variability, and evidence relevant to your joint.
Why modulus and bond-line geometry can outweigh a low shrinkage number
Cure-induced stress depends on when contraction occurs relative to stiffness development. A final modulus value alone does not describe this evolving relationship during UV exposure.
A relatively compliant adhesive may accommodate differential movement, but excessive compliance can permit creep or vibration-induced motion. Alignment retention requires a suitable balance between these behaviors.
A stiff adhesive can resist movement after curing while transmitting greater contraction forces during network formation. Whether that helps depends on the stiffness of neighboring components.
Bond-line thickness influences the amount of contracting material and joint compliance. Thicker gaps can increase available contraction distance, although actual movement remains dependent on constraints.
Very thin joints introduce other concerns, including gap variation, incomplete wetting, and local adhesive starvation. The best thickness is a controlled process choice, not a universal minimum.
Adhesive placement determines how forces act on the assembly. An eccentric deposit can create a bending moment, turning contraction into tilt rather than simple translation.
Symmetric deposits can help balance forces, but only when volume, wetting, stiffness, and cure progression are sufficiently consistent. Visual symmetry alone does not establish mechanical symmetry.
Evaluate placement relative to sensitive optical axes and mechanical supports. A small dispensing change may improve alignment retention more effectively than switching to a lower-shrinkage grade.
How should UV exposure be controlled to protect alignment?
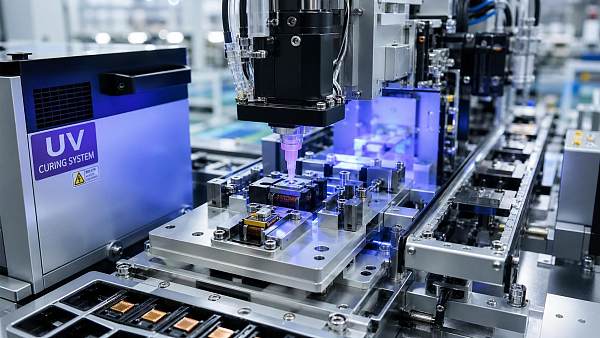
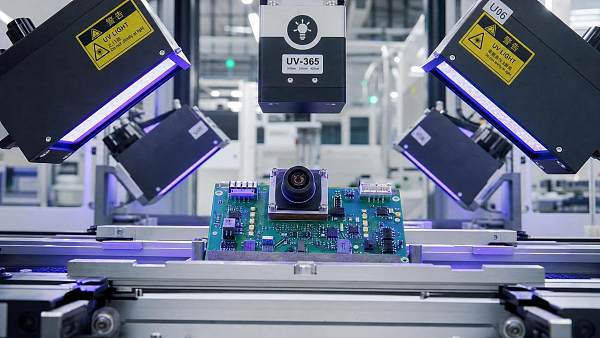
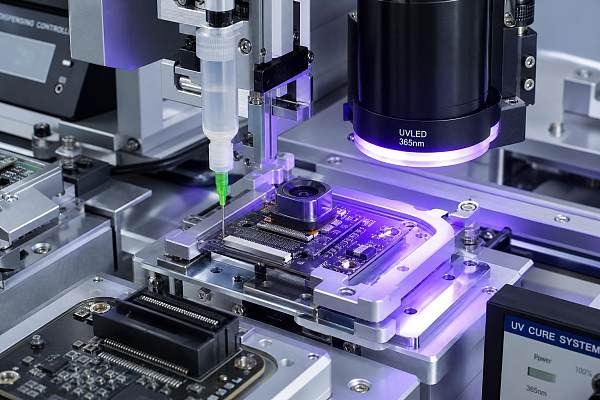
Low shrinkage UV curing adhesives still require a compatible light source. Photoinitiator response, substrate transmission, and adhesive absorption determine whether useful energy reaches the joint.
A system specified for 365 nanometers should not automatically be treated as equivalent under 405-nanometer exposure. Confirm the formulation’s supported spectrum and validated curing conditions.
Measure irradiance at a representative work location, accounting for source distance, angle, and intervening optics. A lamp’s nominal output does not describe exposure inside every joint.
Dose matters, but identical dose does not always produce identical results. Irradiance and exposure duration can change reaction rate, temperature rise, conversion, and stress development.
Shadowed areas are especially important around opaque barrels, metal mounts, and complex housings. A cured exposed fillet does not prove complete curing throughout the bond.
If secondary curing is required, include it in alignment validation. Heat, moisture, or another curing mechanism may introduce additional displacement after the initial UV fixation.
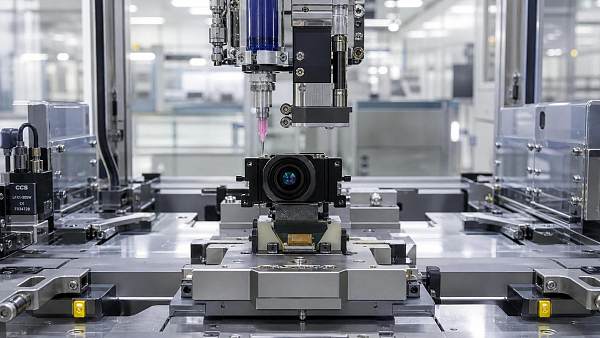
For active alignment, a tack exposure can secure the optimized position before final curing. Validate both stages because the final exposure may still move components.
Temperature rise during illumination can also produce temporary expansion. Measure alignment after thermal stabilization to distinguish lasting cure movement from transient heating effects in the assembly.
What validation test reveals whether alignment will hold?
Start with an optical acceptance limit, then allocate an allowable change to adhesive fixation. The limit should reflect system performance rather than an arbitrary displacement threshold.
For camera modules, appropriate responses may include focus position, sensor tilt, field-dependent image quality, or modulation transfer function measured under controlled imaging conditions during evaluation.
For fiber and photonic assemblies, monitor coupling power or insertion loss alongside mechanical position where practical. Optical measurements capture consequences that coordinate measurements may miss.
Record the aligned baseline before exposure, then measure during tack curing, after full curing, after fixture release, and after a defined stabilization interval at controlled temperature.
Fixture release deserves explicit attention because tooling may conceal adhesive forces. An assembly can appear stable while clamped and move when those constraints are removed.
Track lateral displacement, axial displacement, and angular change where relevant. A single scalar measurement can overlook tilt that strongly affects optical performance across the field.
Establish measurement repeatability before comparing adhesives. Instrument noise, thermal drift, and repositioning error must be small enough to resolve the differences that drive selection decisions.
Use repeated assemblies across representative material lots and process conditions. Report distributions and outliers, because an acceptable average can conceal unacceptable production variation during manufacturing.
A practical screening experiment should vary adhesive grade, deposit volume, bond gap, and exposure schedule. Keep other factors controlled so observed improvements have interpretable causes.
Will the alignment survive temperature, humidity, and operating loads?
Immediate cure performance is only the first checkpoint. Optical assemblies must also tolerate thermal expansion mismatch between glass, metal, polymers, and the cured adhesive network.
The adhesive’s coefficient of thermal expansion matters together with its modulus and joint geometry. A single expansion value cannot independently predict movement in the assembly.
Check mechanical behavior across the intended operating range, especially near glass transition or other stiffness changes. Room-temperature data can miss conditions that permit creep or relaxation.
Humidity exposure can affect adhesive dimensions, mechanical properties, and interface durability. Where relevant, measure both optical drift and bond integrity after moisture conditioning and recovery.
Distinguish reversible movement during an environmental excursion from permanent offset afterward. Both may matter, but they correspond to different operating requirements and potential failure mechanisms.
Use temperature cycling, sustained temperature exposure, and mechanical loading that reflect the application. Add vibration or shock testing when service conditions make these stresses relevant.
For adhesives near optical paths, also evaluate haze, yellowing, migration, and outgassing where applicable. Stable geometry cannot compensate for contamination or reduced transmission during service.
Accelerated testing supports comparison, but lifetime predictions require justified acceleration assumptions. Passing a short environmental screen does not independently establish years of stable optical alignment.
How should technical evaluators shortlist adhesives and dispensing processes?
Build the shortlist around the actual substrates, bond gap, optical tolerance, and available curing access. These constraints eliminate unsuitable products before extensive assembly testing begins.
Request shrinkage methods, viscosity conditions, mechanical properties, recommended exposure parameters, storage requirements, and adhesion data. Ask which properties were measured after the complete recommended cure.
Assess dispensing suitability separately from cured performance. A material that retains alignment in a laboratory joint may create inconsistent deposits on the intended production equipment.
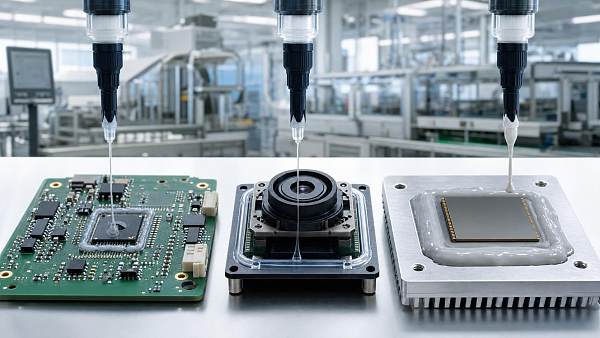
For jet dispensing, verify compatibility with the valve, temperature settings, shot size, and operating frequency. Stable jetting requires application-specific trials rather than viscosity specifications alone.
For needle dispensing, evaluate placement accuracy, stringing, trapped air, and deposit consistency. These defects can change wetting geometry and create uneven forces during curing cycles.
Filled formulations may achieve favorable shrinkage characteristics while introducing optical scattering, sedimentation, or dispensing constraints. Confirm suitability wherever the adhesive intersects an optical path directly.
Compare total process performance: alignment yield, exposure time, rework, inspection burden, and equipment requirements. The lowest material price may increase cost per acceptable assembly produced.
Before qualification, establish change-control expectations for formulation, manufacturing location, and critical raw materials. Production reliability depends on maintaining the properties validated during the initial evaluation.
What should determine the final material choice?
Low shrinkage UV curing adhesives are valuable when cure contraction contributes materially to alignment loss. Their benefit must be demonstrated in the intended assembly geometry.
Select the candidate that consistently meets optical limits after complete curing, fixture release, and relevant environmental exposure. Treat supplier shrinkage figures as screening data within that decision.
Give equal attention to repeatable dispensing and delivered UV exposure. Material performance cannot compensate reliably for uncontrolled bond gaps, asymmetric deposits, or incomplete curing during production.
A successful qualification connects material data to measured optical outcomes and a reproducible process window. That connection turns a promising adhesive specification into defensible engineering evidence.
The clearest purchasing criterion is therefore alignment retention under realistic conditions, supported by consistent processing and durability data. A low shrinkage number strengthens that case.