
Display Bonding Cost Breakdown: Materials, Yield, and Equipment
by
Published
Views:
Why does display bonding cost vary so much from one quote to another?
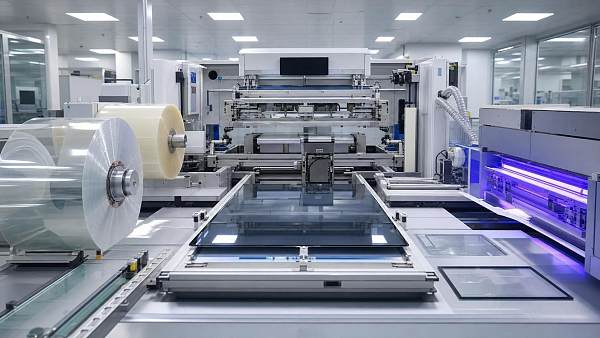
Display bonding cost looks simple at first glance. Many quotes begin with adhesive price, then stop where the real expense actually starts.
In practice, the cost structure includes materials, line yield, curing speed, rework limits, equipment depreciation, and contamination control.
That is why two suppliers can show similar unit pricing while the total display bonding cost ends up far apart.
For touch panels, automotive displays, camera windows, and industrial HMIs, bonding quality directly affects optical clarity, impact resistance, and field reliability.
A lower adhesive quote can become expensive if bubble defects rise, alignment drifts, or curing variation increases scrap.
A more useful way to read display bonding cost is to ask three linked questions: what is consumed, what is lost, and what must be installed.
That broader view is common across bonding and dispensing sectors tracked by IADS, where chemistry and process control usually move together.
When people ask about display bonding cost, what are they really paying for?
The first layer is material. This includes OCA films, LOCA liquids, primers, release liners, cleaning agents, protective films, and packaging loss.
OCA often offers stable thickness and cleaner optics. LOCA can adapt better to uneven surfaces, but process sensitivity may be higher.
The second layer is process loss. Bond-line voids, trapped particles, overflow, and misalignment can quickly reshape display bonding cost.
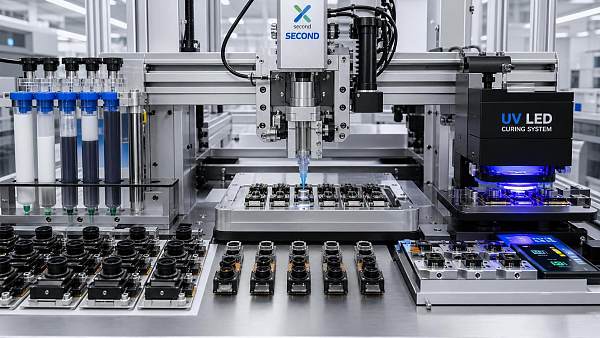
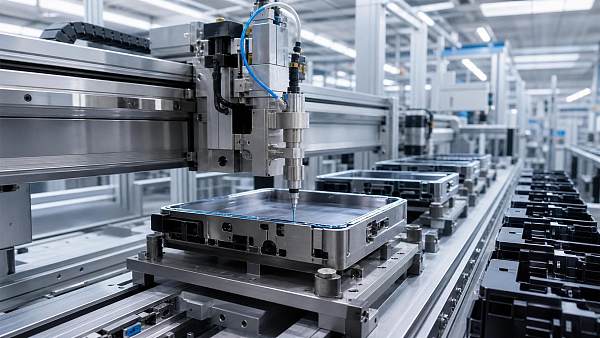
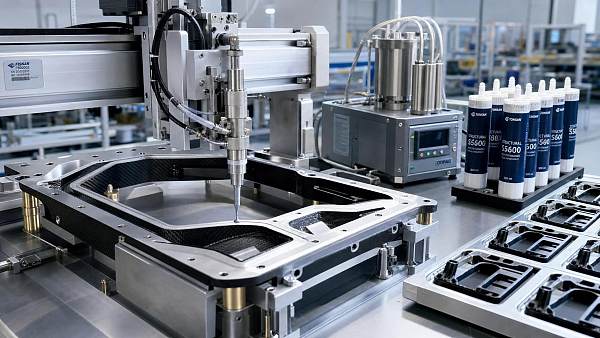
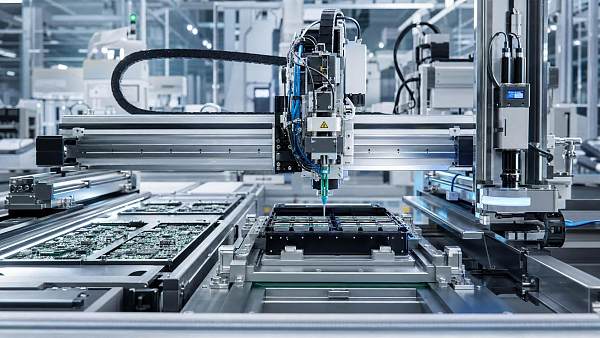
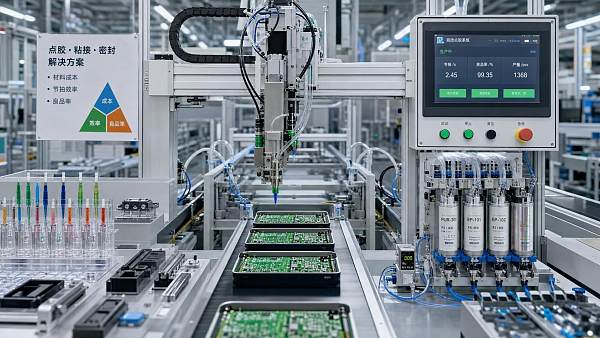
The third layer is equipment. Laminators, vacuum bonding systems, UV curing units, dispensing valves, mixing systems, and inspection tools all matter.
Then there are indirect items that buyers often miss during early comparison:
- Operator training time for material handling and alignment settings.
- Cleanroom or dust-control requirements for optical applications.
- Maintenance parts for pumps, valves, UV lamps, and vacuum components.
- Qualification runs needed before volume production.
- Compliance review for RoHS, REACH SVHC, and outgassing limits.
A realistic display bonding cost model should therefore combine piece price with process stability and capital burden over the planned production period.
How much do materials really influence display bonding cost?
Material cost is important, but it should never be isolated from yield. A cheaper adhesive with unstable wetting can become the expensive option.
OCA pricing is shaped by thickness, optical transmittance, haze level, die-cut complexity, storage conditions, and supplier consistency.
LOCA pricing depends on viscosity control, curing response, yellowing resistance, shrinkage, and compatibility with display stacks.
Some projects also require edge sealing, black masking, or impact-resistant reinforcement. Those additions quietly raise display bonding cost per assembly.
More common hidden material losses include partial cartridge waste, expired shelf life, purge volume, and trial-run consumption.
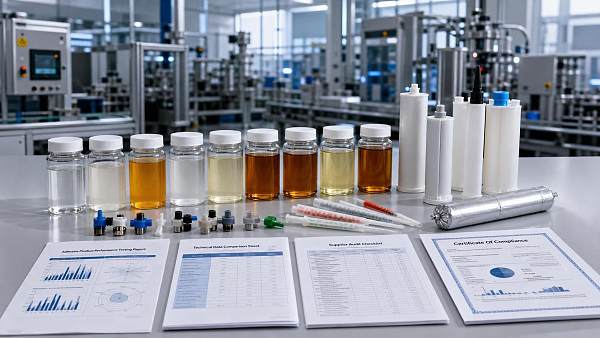
The table below helps separate visible price from actual material economics.
In short, material pricing matters most when it is tied to usable output, not simply to kilograms, rolls, or cartridges.
Is yield the hidden driver behind display bonding cost?
Very often, yes. Yield is where many display bonding cost models become either realistic or misleading.
A one-point drop in yield can erase savings from a lower material quote, especially in medium and large display formats.
The risk is higher when panels are expensive, cover glass is customized, or the module includes sensitive touch structures.
Typical yield losses come from several sources:
- Microbubbles caused by poor deaeration or unstable lamination pressure.
- Particle contamination from packaging, operators, or weak environmental control.
- Cure mismatch that leaves uncured zones or excessive shrinkage.
- Dispensing inconsistency in edge zones and corner fill areas.
- Alignment errors that force rework or complete scrapping.
For this reason, experienced sourcing reviews ask for first-pass yield, final yield, and rework rate separately.
That distinction matters because reworked optical assemblies may pass inspection but still carry durability risk after heat, humidity, or UV exposure.
IADS often highlights this broader process view across dispensing-intensive industries. Stable fluid control is usually cheaper than repeated correction.
How should equipment be evaluated without overstating the capital burden?
Equipment should be measured against output, process window, and maintenance demand, not only purchase price.
A low-cost manual or semi-automatic setup may work for prototyping. It can become costly once volume, repeatability, and traceability requirements grow.
More automated lines usually raise initial spending, yet they may lower display bonding cost over time by improving consistency.
The key is to match equipment sophistication with display size, annual demand, and quality tolerance.
The most useful evaluation points are usually these:
- Can the dispensing or lamination system hold repeatable bond-line control?
- Does the UV source provide uniform curing at the required wavelength and depth?
- Are spare parts, valve seals, and lamp replacements locally available?
- Can vision alignment, vacuum bonding, and inspection data be integrated?
- How long is the qualification cycle before steady production begins?
In optical assembly, equipment and adhesive should be reviewed together. A high-performance glue cannot compensate for unstable jetting or poor curing geometry.
That is also why dispensing platforms, valves, mixers, and fluid control systems deserve the same attention as the bonding material itself.
What mistakes make display bonding cost look lower than it really is?
The most common mistake is comparing only adhesive price. That approach ignores defects, downtime, and qualification friction.
Another mistake is assuming all optical bonding materials are interchangeable if the datasheet shows similar transparency.
They are not. Viscosity behavior, curing response, shrinkage, and substrate adhesion can differ enough to change total display bonding cost significantly.
There is also a tendency to underprice equipment upkeep. UV lamps age, pumps drift, valves wear, and calibration takes time.
A shorter checklist can help avoid false savings:
- Request cost per qualified bonded unit, not only raw material price.
- Separate pilot-line assumptions from mass-production assumptions.
- Confirm actual yield data under similar panel size and cleanliness conditions.
- Check cure time, takt time, and rework rules together.
- Review compliance documents before approval, not after line setup.
This is where technical intelligence platforms become useful. They help connect material science, process behavior, and sourcing decisions in one view.
So how can display bonding cost be compared more accurately before a final sourcing decision?
A strong comparison starts with the application, not the quote sheet. Screen size, stack design, optical target, and production volume define the right cost model.
Then build a side-by-side review covering material, process, and equipment. This avoids overvaluing one attractive number.
A practical comparison usually includes bonded unit cost, expected yield, takt time, maintenance frequency, and field reliability evidence.
It also helps to ask whether the supplier can explain defect control, not just product performance claims.
For industries covered by IADS, that combined evaluation is increasingly standard because adhesive chemistry and dispensing precision are tightly linked.
The best next step is to map the full display bonding cost into four lines: material consumption, yield loss, equipment ownership, and compliance risk.
Once those figures are visible, supplier comparison becomes clearer, hidden losses are easier to spot, and sourcing decisions become more defensible.
Recommended News
 Aug 29, 2026What drives micro-dispensing engineering cost in automated assembly?Micro-dispensing engineering cost is driven by fluid behavior, precision, motion, vision, curing, validation, and uptime. Discover how to control total assembly cost.
 Aug 24, 2026When vacuum potting encapsulation is worth the extra process costVacuum potting encapsulation is worth the extra cost when hidden voids threaten insulation, thermal performance, or long-term reliability. Learn when it reduces risk and protects ROI.
 Aug 22, 2026What drives yield loss in the camera module assembly processCamera module assembly process yield loss often starts with adhesive variation, contamination, curing drift, and alignment shift. Learn the hidden causes and practical fixes.
 Aug 21, 2026What drives camera module adhesives price in high-volume assemblyCamera module adhesives price depends on cure speed, dispensing stability, optical reliability, and supplier consistency. Learn how to compare quotes wisely and reduce total assembly cost.
 Aug 13, 2026Automotive Adhesive Bonding Cost: What Drives Total Assembly Spend?Automotive adhesive bonding cost goes far beyond material price—discover the hidden drivers behind total assembly spend, from curing and dispensing to scrap, uptime, and warranty risk.
 Aug 20, 2026Inspection Points That Matter When Evaluating Used Rubber MachineryUsed rubber machinery inspection starts with process fit, then checks wear, controls, safety, and relocation risk—learn the key points to cut hidden costs and buy with confidence.
 Aug 09, 2026How the Camera Module Assembly Process Affects Yield and Alignment AccuracyCamera module assembly process directly impacts yield and alignment accuracy. Learn how dispensing, curing, and active alignment choices reduce defects and improve optical performance.
 Aug 06, 2026How to Evaluate Lightweight Bonding Solutions for Rail InteriorsLightweight bonding solutions for rail: learn how to compare fire safety, substrate compatibility, vibration durability, and process efficiency to choose smarter rail interior bonding systems.
 Aug 01, 2026What Drives Automated Dispensing Cost in High-Volume Assembly Lines?Automated dispensing cost depends on more than machine price. Learn the key drivers—materials, accuracy, cycle time, maintenance, and scrap—to compare suppliers and cut total assembly line cost.
 Jul 29, 2026What Fluid Dispensing Precision Really Costs in Yield, Rework, and Cycle TimeFluid dispensing precision directly impacts yield, rework, and cycle time. Learn how hidden dispensing costs erode margins and what to verify before investing.
 Jul 28, 2026Automated Dispensing Integration: Cost, Uptime, and ROI FactorsAutomated dispensing integration: learn how to reduce cost, improve uptime, and strengthen ROI with smarter material selection, maintenance planning, software integration, and validation strategies.
 Jul 24, 2026How to Evaluate Lightweight Assembly Adhesives for Faster Bonding and Lower Total CostLightweight assembly adhesives: learn how to compare cure speed, dispensing stability, substrate fit, and total cost to choose faster, more reliable bonding solutions.
 Jul 23, 2026Desktop Automated Dispensing Systems: Cost, Accuracy, and ROI Factors to CompareDesktop automated dispensing systems compared by cost, accuracy, and ROI. Learn how to evaluate repeatability, integration, throughput, and long-term savings before you buy.
 Jul 18, 2026Display Bonding Cost Breakdown: Materials, Yield, and EquipmentDisplay bonding cost explained: compare materials, yield, and equipment to uncover hidden expenses, reduce scrap, and make smarter sourcing decisions with confidence.
 Jul 15, 2026Adhesive Joint Evaluation Supplier Checklist for Reliable Test ResultsAdhesive joint evaluation supplier checklist for reliable test results. Compare labs, reduce risk, verify quality systems, and choose a partner with confidence.
 Jul 14, 2026Automotive Adhesive Market Trends to Watch in 2026Adhesive market trends automotive leaders should watch in 2026: EV battery materials, lightweight bonding, automation fit, and compliance shifts shaping smarter sourcing decisions.
 Jul 14, 2026Industrial Adhesives for Assembly: Cost vs ThroughputIndustrial adhesives for assembly: compare cost vs throughput, uncover hidden process costs, and choose faster, more reliable bonding solutions for higher line efficiency.
 Jul 13, 2026Structural Sealing Cost: What Drives Total Assembly SpendStructural sealing cost goes beyond material price. Learn what drives total assembly spend and how smarter sealants, dispensing, and cure control can cut waste and improve ROI.
 Jul 12, 2026When Automated Dispensing Systems Manufacturers Deliver Better Assembly ROIAutomated dispensing systems manufacturer selection drives assembly ROI when it cuts material waste, boosts precision, and supports scalable integration. Learn what separates true process partners from machine sellers.
 Jul 10, 2026Adhesive Supplier Evaluation Audit: What to Check Before ApprovalAdhesive supplier evaluation audit guide: learn what to check before approval, from quality systems and batch consistency to compliance, safety, and process capability.
 Jul 08, 2026Adhesive Total Cost Model: What Actually Drives Assembly Cost?Adhesive total cost model explained: discover what really drives assembly cost beyond unit price, from labor and cycle time to scrap, maintenance, compliance, and throughput.
 Jul 04, 2026Adhesive Supplier Intelligence Platform: What to Compare Before Shortlisting VendorsAdhesive supplier intelligence platform guide: compare application fit, compliance, dispensing compatibility, and supply reliability before shortlisting vendors for faster, lower-risk sourcing.
 Jul 03, 2026Adhesive Lightweighting Applications in Automotive: Where the Real Weight Savings Come FromAdhesive lightweighting applications automotive create real savings through joint redesign, fewer brackets, mixed-material bonding, and EV battery integration. Learn where mass drops fastest.
 Jul 02, 2026Industrial Adhesive Supplier Directory: How to Shortlist Reliable Vendors FastIndustrial adhesive supplier directory guide to help buyers shortlist reliable vendors fast. Learn how to filter by application fit, compliance, process support, and response quality.
Editor's Selection
The Archive Newsletter
Critical industrial intelligence delivered every Tuesday. Peer-reviewed summaries of the week's most impactful logistics and market shifts.